Scientists have now produced a new ultra‑detailed map of the frozen continent’s hidden ground, revealing twice as many hills as expected and a colossal valley system stretching for hundreds of kilometres.
The hidden continent beneath two kilometres of ice
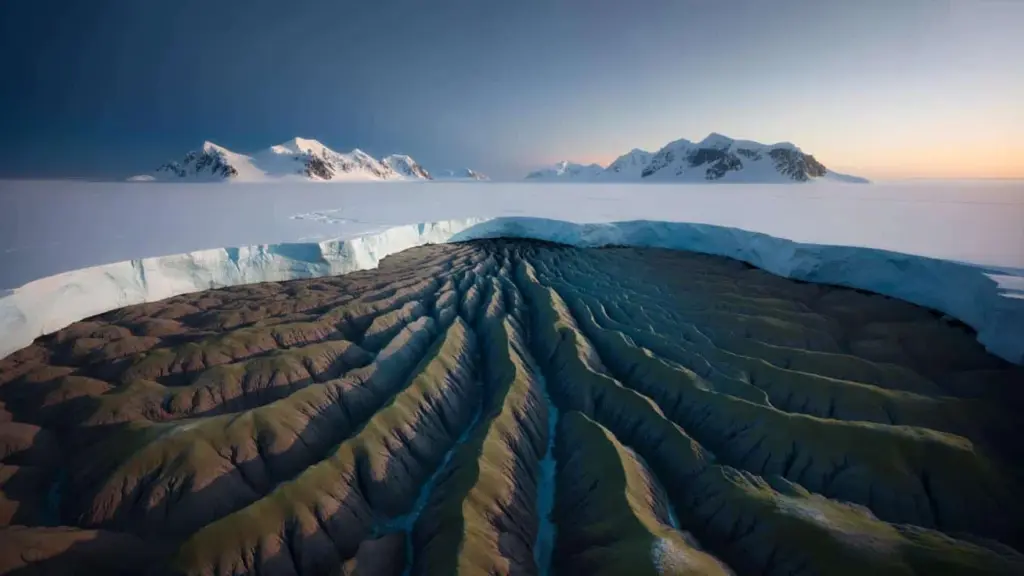
Antarctica looks simple from space: a smooth, blinding sheet of ice. In reality, the ground beneath is anything but simple. Under nearly two kilometres of ice in places, the continent holds steep ridges, deep basins and canyons that rival those of North America or Asia.
This buried landscape shapes both the flow of ice and the fate of future sea levels. Until recently, much of it was only roughly known. Radar surveys left large gaps, especially in remote inland regions and around the edges of fast‑melting glaciers.
The new map reveals a jagged, restless land, not the flat, featureless bed many models had quietly assumed.
The work, produced by an international team using a mix of satellite data, aircraft radar and advanced modelling, gives researchers a sharper view of the Antarctic bedrock than ever before.
A map with twice as many hills and a giant buried valley
One of the headline findings is the sheer number of small hills and ridges hidden under the ice. The team identified roughly twice as many of these features compared with earlier reconstructions. These modest‑sized bumps matter, because they can slow, deflect or channel the ice sliding above them.
The other star of the new map is a giant valley system. This immense trough runs beneath the ice like a dry, buried river corridor. In some sections, it sits far below sea level and reaches depths of several kilometres.
The newly mapped valley forms a kind of subglacial motorway, potentially allowing ice to accelerate towards the coast if conditions change.
Scientists say this valley likely formed long before Antarctica froze over, carved by ancient rivers or tectonic forces when the continent’s climate was closer to today’s temperate zones.
➡️ Rentner zahlt landwirtschaftssteuer für imkerland und fragt sich ob der staat zu weit geht
➡️ A giraffe with a strange neck in South Africa baffles scientists
➡️ Wenn der klimakleber vor ihrem auto steht pendler im stau polizei im dauereinsatz eine geschichte die die republik spaltet
➡️ “I make it every Sunday in winter”: the potato and Brussels sprout bake that won over my whole family
➡️ The Artemis II crew has been placed in quarantine: here’s why
➡️ Did you know the tit acts as an ecological barometer in your garden? Here’s why
➡️ In the desert, they are building an “artificial sun” to power cities
➡️ Wie eine schulreform eine kleinstadt spaltet und warum eltern und lehrer sich wegen gendersprache im klassenzimmer unerbittlich bekämpfen
Why hills matter as much as mountains
In everyday language, these “hills” might not sound dramatic. Many rise only a few tens or hundreds of metres from the surrounding bed. Yet, in the language of ice dynamics, they can be critical obstacles.
Ice responds to friction. When it encounters rough ground, it slows. When it passes over smoother, gently sloping terrain, it can speed up. Clusters of small hills can act almost like teeth on a gear, making it harder for the ice sheet to slide seaward.
By doubling the count of such features, the new map forces climate models to adjust their view of how easily Antarctic ice could move in a warming world.
How scientists mapped a continent they cannot see
Directly drilling to the bedrock under kilometres of ice is rare and expensive. Instead, researchers used a combination of techniques that complement each other.
- Aircraft flying over Antarctica sent radio waves through the ice and recorded the echoes from the rock below.
- Satellites tracked slight changes in the height and speed of the ice surface over time.
- Computer models used physics to infer the most likely shape of the bed that would produce the observed ice behaviour.
These ingredients were combined in a project similar to earlier efforts such as BedMachine, which already revealed some of Earth’s deepest canyons under the Antarctic ice. The famous example is under Denman Glacier, where the bed plunges to more than 3.5 kilometres below sea level, making it the deepest land point on the planet.
By stitching scattered measurements into a single high‑resolution map, scientists turned a fuzzy sketch of Antarctica’s underbelly into a detailed atlas.
What the new map changes for sea‑level forecasts
The future of global coastlines depends partly on how fast Antarctic ice can flow into the ocean. That, in turn, depends on what lies underneath.
The newly mapped hills and valleys show where ice is likely to remain pinned and where it might start to accelerate. Regions where the bed deepens inland and lies below sea level are of special concern, because they are prone to a process called “marine ice sheet instability”. Once the grounding line — where ice leaves the bedrock and begins to float — retreats into deeper basins, retreat can continue on its own, even if warming slows.
The giant valley system highlighted in the new work may mark such a vulnerable zone. If warm ocean water reaches the base of glaciers that sit above this valley, the ice could thin, unground and begin a long retreat along the buried trough.
| Key feature | Why it matters |
|---|---|
| Extra hills and ridges | Increase friction, can slow or redirect ice flow |
| Giant subglacial valley | Provides a deep pathway for potential rapid retreat |
| Deep basins below sea level | Prone to marine ice sheet instability |
| Updated bed elevation | Improves climate and sea‑level rise projections |
Antarctica’s role in tomorrow’s climate
The Antarctic ice sheet today stores enough frozen water to raise global sea levels by nearly 60 metres if it all melted. No scientist expects that to happen quickly, but even a small fraction would reshape coastlines.
Understanding where the ice is most vulnerable guides everything from flood‑defence planning in London and New York to long‑term infrastructure decisions in low‑lying Asian megacities.
The new map does not change the basic story of rising seas, but it sharpens where, when and how fast that rise might unfold.
Armed with better bedrock data, climate models can now run more realistic simulations. These simulations test scenarios such as a 2 °C or 3 °C warmer planet, or changes in the strength of warm ocean currents that nibble at Antarctic ice shelves from below.
Key terms that help make sense of the map
A few technical phrases keep appearing in this research, and understanding them helps clarify what is at stake.
- Ice shelf: The floating extension of a glacier or ice sheet. When it thins or breaks up, the grounded ice behind it can speed up.
- Grounding line: The boundary where ice stops resting on bedrock and begins to float. Its position is a crucial indicator of stability.
- Subglacial: Anything located beneath the ice, including lakes, rivers, valleys and hills.
- Basal melt: Melting at the base of the ice sheet, often driven by contact with relatively warm ocean water.
What the new landscape means for future research
The enriched picture of Antarctica’s under‑ice terrain will guide where scientists focus next. Deep valleys, steep slopes and suspected subglacial lakes become priority targets for future radar flights, seismic surveys and, in some cases, drilling projects.
Researchers can also use the map to test how sensitive individual glaciers are to different warming pathways. For instance, one scenario might simulate stronger winds pushing warmer water onto the Antarctic continental shelf, attacking ice shelves that currently buttress major outlet glaciers. Another could examine what happens if snowfall increases inland while coastal melting accelerates.
For people far from the poles, this can feel distant. Yet the shape of a hidden hill under Antarctic ice may one day matter for whether a coastal home faces nuisance flooding twice a year or once a decade. The new map turns those hidden hills and valleys from vague guesses into measurable features that can be tracked, monitored and incorporated into long‑range planning.